Wind turbine operators and owners are presented a range of performance enhancing retrofit options by OEMs and third parties. Such offerings are accompanied by specific details of the expected performance improvements in terms of AEP (Annual Energy Production).
However, these claims can be very difficult to verify independently. The current best practice for AEP gain verification, as dictated by the IEC, would involve a PCV (power curve verification) campaign before and after the retrofit is performed on the turbine. These campaigns require the use of additional and independent wind measurement device(s).
Unfortunately, the cost of carrying out such verification campaigns is sometimes higher than the retrofit itself and, therefore, can only be performed on selected candidate turbines of a wind farm. This results in relatively high levels of uncertainty surrounding the overall gain that can be achieved at a wind farm or fleet level.
Our SkySpecs Performance team investigated the use of SCADA 10-minute data as a pragmatic means of quickly and efficiently assessing potential AEP gains. Here’s how they did it and what they found.
Method
The SkySpecs Performance team started by collecting 10-minute SCADA data before and after the installation of the retrofits to evaluate the impact on wind turbine performance. For accuracy, they aimed for a timeframe of 12 months or more before and 6 months or more after the installation.
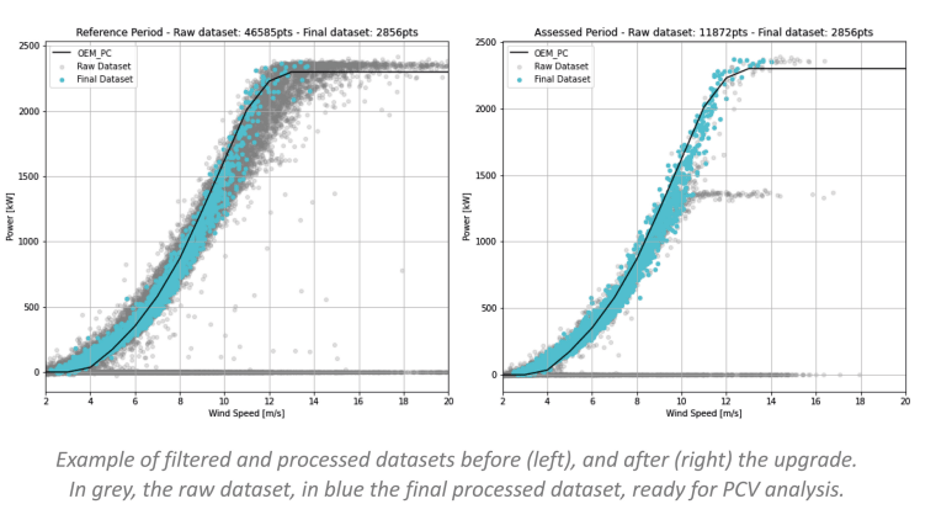
Then, using only the 10 minute database, they automatically filtered out periods of abnormal turbine operating using state detection algorithms to ensure strict filtering and optimal data quality without the need for event logs.
To enhance the dataset, they coupled the filtered 10 minute datasets with external environmental data from a weather API provider. Depending on the location of the turbine, this allowed the team to obtain new variables such as pressure, temperature, humidity, rainfall, and snow events. These additional variables allowed the team to then perform air density correction, and further filtering.
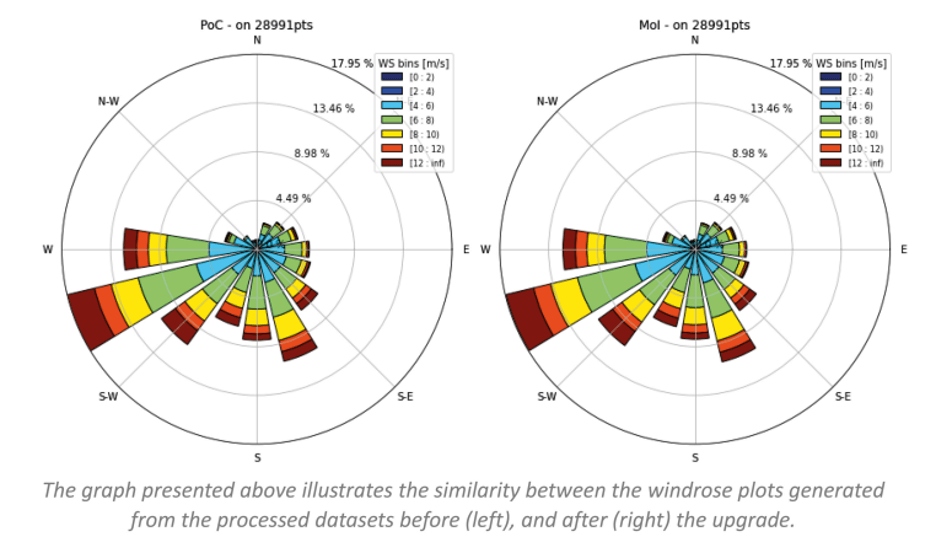
10 minute data points from “before” and “after” periods were then matched, based on all of the environmental variables to allow accurate comparison and evaluation of turbine performance, ensuring both datasets cover the same ranges of conditions and events, and also eliminated environmental variations that could have affected the results. Properly matching each environmental variable in both the “before” and “after” dataset was crucial for reliable results. Also, the statistical distribution of each environmental variable needed to be identical in both datasets.

Lastly, a standard PCV analysis was performed on both datasets (similar to the IEC process), and calculated the AEP using the wind distribution from the entire dataset.
Core Assumptions & Limitations
This comparison analysis was highly dependent on the Ceteris Paribus assumption, which assumes that all relevant variables are held constant, except the one being studied. In this case, we assume that the sensor measuring the environmental variables remained unchanged throughout the periods, while the power output had the potential to change due to the retrofit.A
The Results
Once all pre-processing steps had been applied to the dataset, the data analyst obtained two datasets where the wind turbine was in normal operation and the environmental conditions were precisely identical. This filtered and preprocessed dataset could then be used for the assessment of the upgrade.
Ceteris Paribus, a comparison is now possible.

Once the AEP was calculated for both the “before” and “after” periods, the influence of the upgrade on AEP, or the “Delta AEP” could then be computed. Through the team’s experience, they found that aggregating these deltas at the wind farm level and studying the general trend in results provided insights into the actual gains of retrofit installations, particularly when the wind farm included control turbines that did not receive upgrades.
The Results
When using SCADA data for portfolio-level analysis, it is almost impossible to obtain calibration reports and mounting information for each sensor of each turbine. In many cases, sensors such as nacelle anemometers and temperature sensors do not even undergo any traceable calibration. Due to these limitations, it is not possible to perform a full propagation of uncertainties (Type A+B) in a SCADA- based analysis.
However, this method offers a pragmatic and cost-effective approach for wind farm owners and operators who want to assess the effectiveness of retrofits.
To discuss this approach for your wind farm or turbines, click below to arrange a discussion with the SkySpecs Performance team.


