It is well-established that air density has an influence on wind turbine (WTG) performance. This needs to be accounted for when conducting performance analysis following industry best practices.
Unfortunately, in many SCADA analyses, this normalization is either partially performed, using only temperature, or completely excluded. It is typically due to the absence of one or more of the required signals, namely pressure, temperature, and humidity (PTH) in the studied dataset.
Interconnection of databases using Application Programming Interfaces (API) is now easier than it ever was, and a multitude of web services have emerged, enabling direct and automated access to various historical weather datasets.
In this study, the SkySpecs Performance team explored the validity of using such weather data in the context of air density normalization of WTG SCADA data, and this air density normalization is now a standard practice for all of the team’s performance reports and wind turbine fleets.
Fundamentals: Air Density Normalization
One process for air density normalization is described in the International Electrotechnical Commission (IEC) standard for ‘Power Performance Measurements of Electricity Producing Wind Turbines,’ also known as 61400-12-1. Other methods exist, but this one is well accepted and used in the industry by many actors. This normalization is necessary so that on-site measurements can be compared with OEM-provided data, namely the OEM power curve (PC).
Air density correction is valuable because OEMs provide a warranted power curve that will be the basis to evaluate performance throughout the life of a wind farm. The power curve is usually given at a reference air density of 1.225kg/m³, which corresponds to the global average air density at sea level. However, the true conditions depend on the turbine’s location, specifically its elevation, as well as local weather conditions. If left uncorrected, one could compare an OEM power curve with a locally measured power curve and mistakenly believe that the turbine is experiencing heavy losses, when in reality, the visible effect is only due to lower air density.
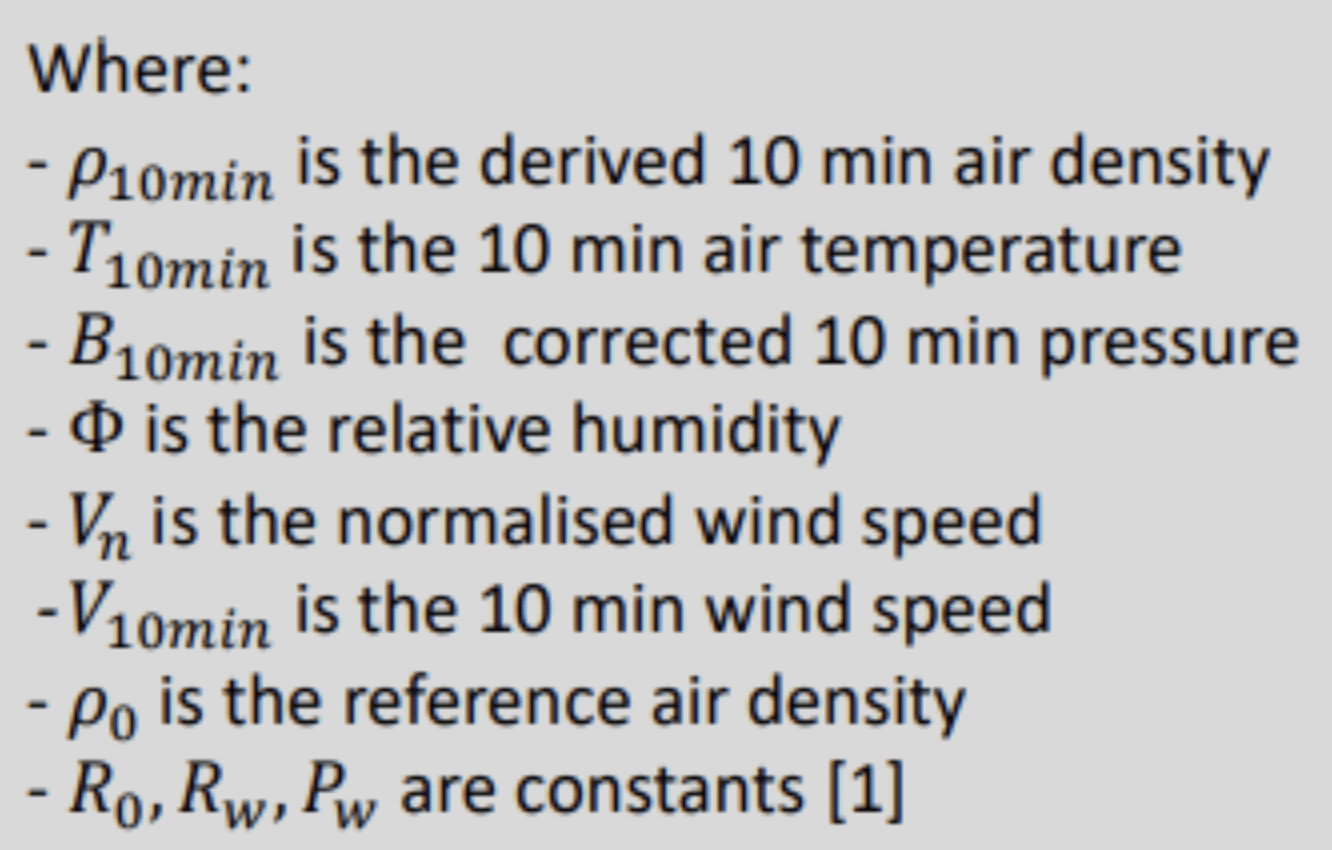
Following the recommendations from IEC 61400-12-1, “the wind speed signal shall be normalized to a reference air density”, generally being 1.225 kg/m3 . “The air density shall be determined from measured air temperature, air pressure and relative humidity” according to:

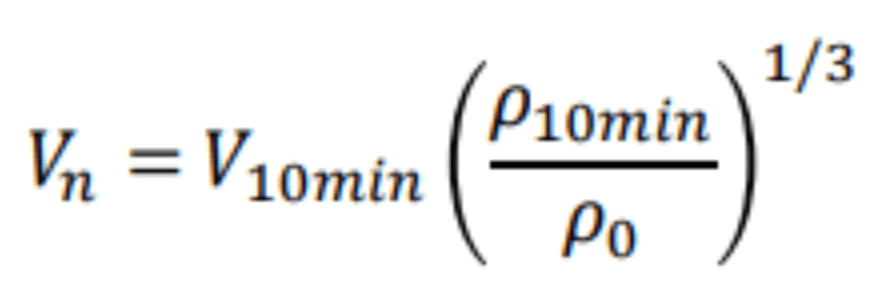
For modern WTGs, the normalization is applied to the wind speed following:
However, pressure and humidity are commonly missing from the OEM SCADA 10min database.
Furthermore, the available air temperature can be affected by the sensor’s position on the nacelle, sometimes over-estimating the outside temperature. These limitations often inhibit the full application of the normalization method using SCADA data.
Enlarge SCADA data with Historical Weather APIs
Given a set of geo-coordinates, most weather-data providers can now deliver worldwide sub-hourly historical datasets, geographically interpolated from all nearby weather stations within a predefined radius.
To sample the quality of these services, we conducted several comparisons with local observations. In the assessment below, we studied 5 years of data from a local met mast under management against the same period extracted from the selected weather service interpolated at this met mast location. The graphs below show the correlations obtained for temperature and humidity measurement from both datasets as well as a sample of temporal comparison.
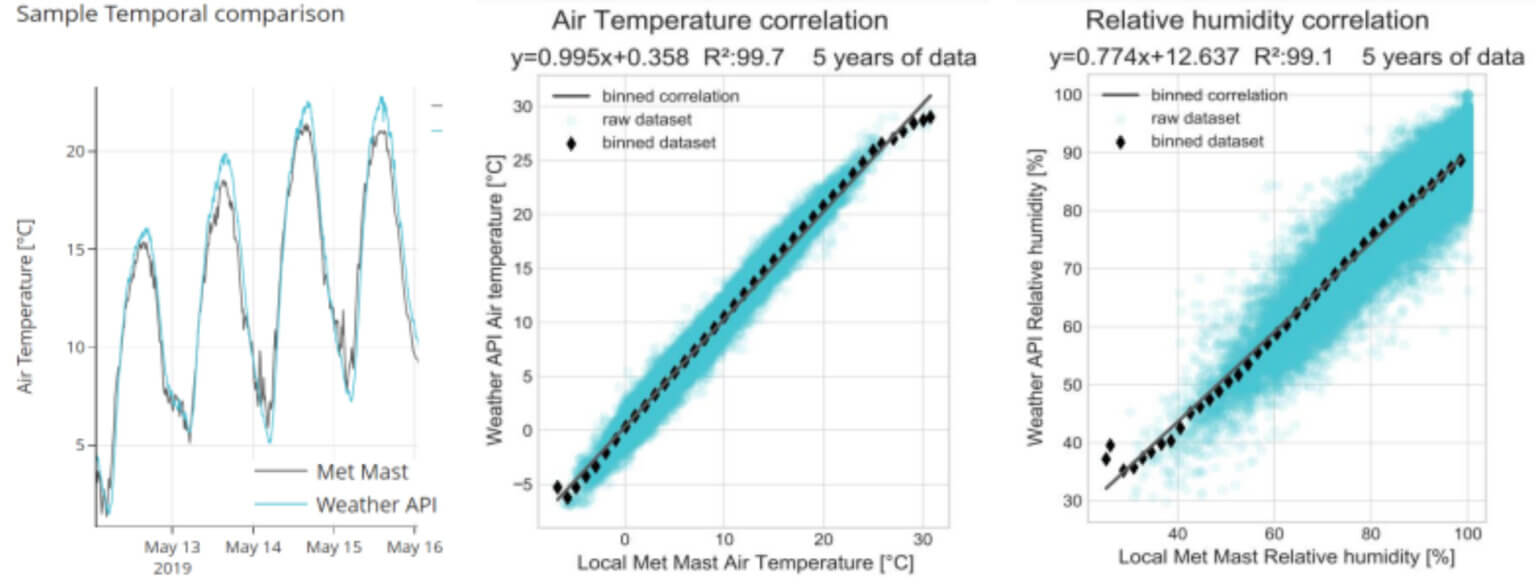
Thanks to the very high temporal and spatial inertia of the signals needed for air density normalization, we see a good correlation between local observations and the geographically interpolated data from the weather API. As seen in the first graph, daily variations at the tested location are covered with sufficient accuracy. And using weather data from major weather providers has the benefit of continual improvement. As the weather provider’s interpolation methods improve, so does our analysis.
Assessing the effect on the Power Curve
The main expected effect of the normalization on the dataset is to correct wind speeds to a value equivalent to the reference air density, 𝜌0. Since met masts are not available for all WTGs in our portfolio, we cannot automatically check the quality of weather data for each location. However, an additional benefit of the normalization is also the reduction of the scatter of the power curve (PC) when observed across a period where air density had varied.
This was judged to be one method to check whether the process had a positive impact. If that scatter remains the same or increases, it implies that the method had either no effect or a negative one on the dataset. On the other hand, any significant reduction on the scatter would indicate that the normalization reduces uncertainty. The graph below compares the standard deviation of the power signal (Power_Sdv) binned using the raw wind speed and the normalized wind speed, i.e. using the Weather API data for one of the WTG in the portfolio.
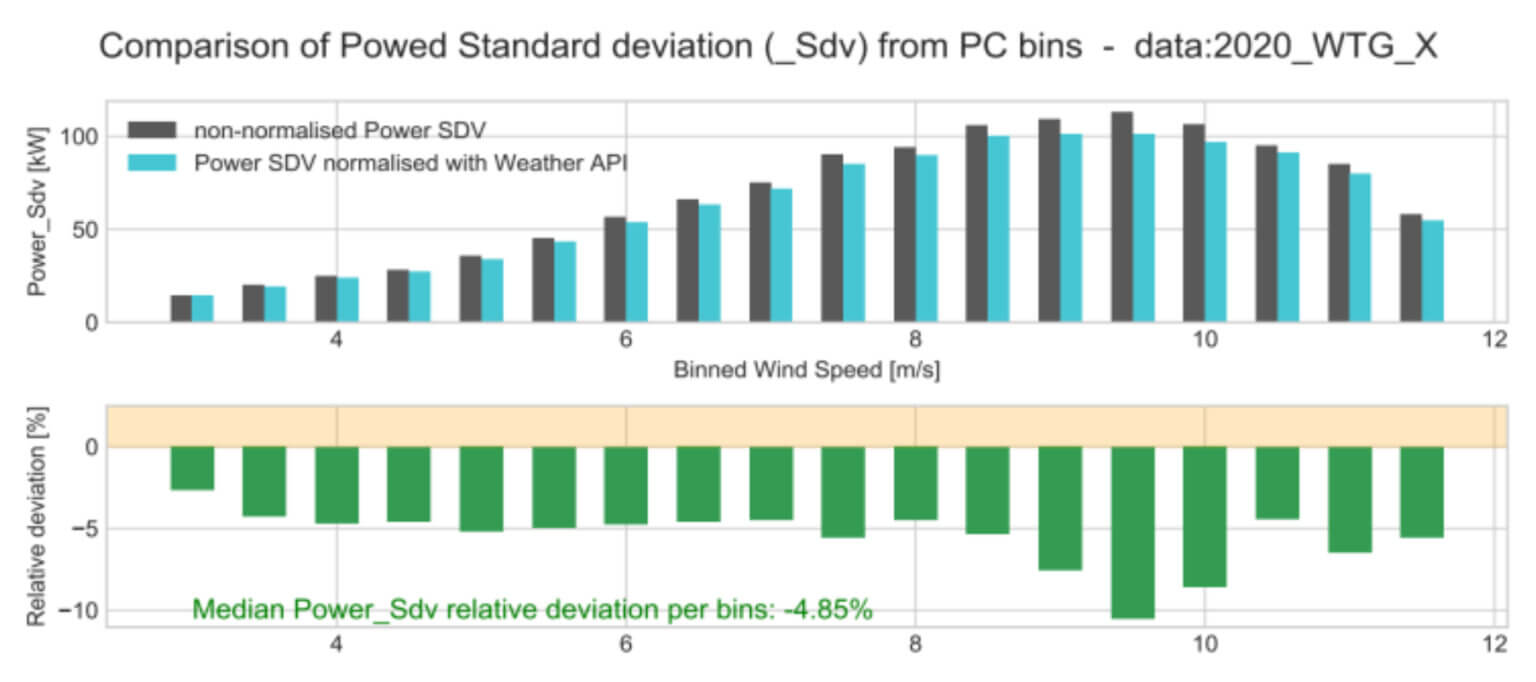
When analyzing the PCs over a year, the Power_Sdv is slightly but consistently reduced (- 4.85% in the analysis above). When deploying that metric on a whole portfolio, we found an average reduction of the binned Power_Sdv of about -4%.
Cost and Requirements
The cost of most weather web services can be considered low for recurring large scale fleet analysis. Additional computational power for the API requests, data correction, resynchronization and filtering and its additional cost can also be considered almost negligible, if implemented properly.
The sea-level pressure provided by the API should be corrected to hub height. To do so, we used the hypsometric equation in combination with the WTG altitude and hub height. The altitude of a WTG, if unknown, can be retrieved automatically using the SRTM database. Therefore, the only input required for the implementation of the process are the coordinates of the WTG and its hub height.
Conclusion
- Although the use of a local and controlled PTH sensor is industry standard, the use of remote weather data is preferable to the current status-quo of doing nothing, i.e. when no PTH information is available, the normalization is performed partially or ignored. For those who do not have the option of installing a local sensor, we have demonstrated that this approach is a pragmatic step versus the alternative of doing nothing at all.
- Obtaining weather data via APIs is a pragmatic solution to enhance the quality of predominantly SCADA-based analysis. For the case of air density normalization, it avoids falsely diagnosed under-performance or perceived seasonal effects which in fact may originate from air density variations.
- Given the results of this pragmatic approach, it was deemed suitable for immediate deployment and used for regular, automated analysis of the performance of several thousand WTGs. The adoption of this method enables asset managers, often bound to SCADA datasets, to refer to more accurate power curves which comply more closely with industry best practices.
Learn more about how this could benefit your wind assets, and schedule a call with the SkySpecs Performance team.


